Laffer Curve/
Reagonomics/
Trickle-down/
Universal B.I.
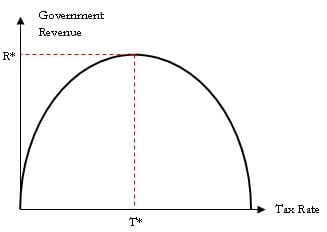
(Econ 101 for Fiat Currency)After observing that zero taxes give the government zero and 100% taxes make the incentive to work zero, the (dubious )curve shown was sketched.
In a two-party system, political combatants shout "tax the rich; redistribute the wealth" or "all taxes do is kill jobs". Nobody acts as a referee, understanding what is really happening.
Logically, somewhere between those extremes, the government would maximize its revenue. In fact, the $US was a fiat currency after 1971, so taxation had become a way to prevent inflation when money was created. Conservative thinking clung to the gold standard as the only real money. Reagan later trade-marked this thinking and because his messaging inspired entrepreneurism, "trickle-down" worked - his followers invested rather than just spending.
At that time, production was limited by capital, which by the Savings Identity is in the hands of "the Rich". Taxes were adequate for band-aid solutions to help "the Poor". "The Rich" expanded the productivity of factories etc. and got even richer by selling much more at somewhat lower prices.
Another reason cutting taxes worked; the extra production needed lots of added workers, and "the Rich" had to pay them a lot more to produce enough to meet the increased demand from lower prices. The result was Middle Class vigor. The Velocity of Circulation increased and the government swooped in and got back what it had granted to "the Rich" by taxing it from workers.
The workers did not complain, because their take-home pay was rising faster than ever. Other people tolerated this because taxes still covered band-aid solutions for "the Poor". In summary:
However in 2024, the Middle Class is being suppressed, suggesting that we are on or approaching the declining side of the Laffer Curve and need to adjust the deployment of capital so that Demand can balance Production more equitably between "the Poor" and "the Rich".
Try changing tax rates and government efficiency below to explore what "perturbation theory" reveals about their effects near actual 2024 conditions:
Inflation was 2.4%/yr, prime interest rate was 7.5%/yr, unemployment was 6.7% and Supply and Demand both equaled GDP of $2241 Billion. GDP growth rate has been near 2%/yr. detail

 The Supply and Demand