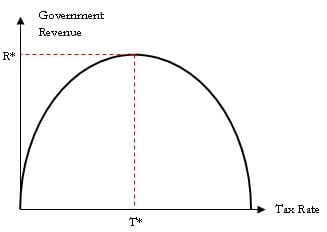
After observing that zero taxes give the government zero and 100% taxes
make the incentive to work zero, the
curve shown was sketched.
In a two-party system, political
combatants shout "tax the rich; redistribute the wealth"
or "all taxes do is kill jobs".
Nobody acts as a referee considering the whole curve.
Logically,
somewhere between those extremes, the government
would maximize its revenue.
Reagan
trade-marked this thinking and
because taxes at the time were excessive, "trickle-down" worked
when he reduced them.
At that time, production was limited by capital,
which by the
Savings Identity is in the hands of "the Rich".
Only those who have extra income can deploy it into capital and
taxes were transferring it into band-aid solutions to help "the Poor".
When Reagan reduced their taxes "the Rich" expanded the productivity
of factories etc. and got even richer by selling much more at somewhat
lower prices.
A third reason cutting taxes worked; the extra production
from capital investment needed lots of added workers,
and "the Rich" had to pay them a lot more to produce enough to meet
the increased demand from lower prices. That created a Middle Class.
The government swooped in and got back what it had granted to
"the Rich" by taxing it from workers.
The workers did not complain, because their take-home pay was
rising faster than ever.
Other people tolerated this because taxes still covered band-aid
solutions for "the Poor".
It worked because at that time
Production Was Short of Capital.
However in 2024, the Middle Class is being suppressed, suggesting
that we are on or approaching the declining side of the
Laffer Curve and need to adjust the deployment of capital so
that Demand can balance Production more equitably between
"the Poor" and "the Rich".
WARNING: X and Y multipliers work differently below.
Try changing tax rates below to explore what
"perturbation theory" reveals about the shape of the
Laffer Curve near actual 2024 conditions:
Inflation was 2.4%/yr,
prime interest rate was 7.5%/yr,
unemployment was 6.7% and
Supply and Demand both equaled GDP of $2241 Billion.
GDP growth rate has been near 2%/yr.
Total Capital in the Canadian Economy: $20000Bn, approximated by
non-Government 77% of equilibrium between supply and
demand in 2024 / 8.54% return On Capital from web data.
GDP equals spending;
23% spending by Governments, the revenue for which was
Personal Income Tax 46.4%,
Non-Resident Income Tax: 2.9%
($254.1Bn total)
Corporate Income Tax: 21.0%,
($108.24Bn)
Other: (GST, energy taxes, etc.) 29.5%.
($152.05Bn)
77% requiring capital: ($20,200Bn)
Average net profit margin was 8.54%. (Gross across all industries 36.56%)
Thus total capital is about 0.77*2.241/0.0854, which equals $20.2 $Trillion.
Total asset value of Canadian businesses was $17 trillion as of 2022. ($2.5 trillion foreign-controlled.)
We will use $20 trillion working capital.
55% on consumption & debt
=>Shelter accounted for 32.1% ($396Bn) and food 15.7% ($192Bn)
of consumption. =>
Household mortgages are a large portion of debt.
The total value of Canada's housing assets was
$4200 Bn in 2024, so the equivalent of rent would be .396/4.2 or 9.4%/yr.
=>~1/3 of households (~5 million) rent their homes.
=>
Household debt was 176.4% of disposable (gross-tax) income.
This ratio is similar over income levels.
21% on investment
=>
Households saved approximately $3785 each: 3.8% of GDP,
totaling $85.2 billion.
Savings are what is left over after Consumption, Interest and Taxes;
and by the Savings Identity,
it is part of overall Investment of 21% of GDP.
and 1% net exports.
The need for investment/savings drives the "tax and spend"
objection of the political right.
However, lower labor cost gives corporate savings
to invest when wages do not have to cover services
and infrastructure that are public.
GDP also equals income:
distributed over 31.814 million tax returns
(22.5 million households).
Corporate Income comes from Consumer spending
Part of it is diverted into Savings/Investment,
but much of the $20,200Bn investment is financed by debt.
=>Debt-to-assets ratio for Canadian private non-financial corporations was 44.20% in Q2 2024.
Small/Medium businesses employed 64% of private sector labor force.
We will assume they were all private.
=>Thus their debt is ~44.2% of 64% of $20Trillion or 5.7 Trillion.
=>For a public company Debt-to-assets ratio is around 67%.
By the above assumptions and reasoning, their debt is ~67% of 36% of $20Tn or $2.8 Trillion.
=>Note that these are rough approximations that hopefully show the effects of Central Bank policy changes below.
Average Individual Gross Income: $70440.686490224
from $Bn 2241 GDP/ 31.8 million tax returns.
Ave CPP Dividend: $3210 from
total Capital / number of Returns *
3% Dividend of User-selected 3210%
(Selected Below) of
the above Total Capital.
Then a ten-row six-column array is filled.
The [0] column is pre-loaded with fractions
between 2.7% and 23% of the total GDP earned by
ten deciles of tax returns. The [1] column is
then filled with $amounts with no UBI supplements.
This will be initialized using the above $2.24Trillion,
and then it will be used to perform the calculations below.
There will be a second pass through, using a new GDP
that will be predicted from Supply and Demand
calculations below.
array
The [2] column is also pre-loaded with multipliers
for the uneven distribution of capital described above.
The [3] column becomes the product of these
multipliers and the UBI fraction of the GDP on a
per-return basis. These $amounts are summed and
then re-adjusted to boost the lowest deciles by
an equal amount, while reducing upper deciles only
by the dividends that have been diverted to the
UBI investment fund. Thus
Only dividends give the UBI boost.
Federal and Alberta income tax brackets are approximated
in functions which are applied to each of the ten
deciles, [2] plus [3] column and stored in the
[4] column. These approximations do not include the
deductions in a tax return, so they are scaled
proportionately to make their sum equal published
income tax revenue.
Scale factor: 83
The [5] column is HouseHold Debt, which is 176.4% of
Disposable Income. This percentage applies well to
all but the top two or three deciles, so the total
was calculated and adjusted to linearly increase
rather than following the rapidly rising incomes
at the top. The [5] column gives this approximate
debt load for taxpayers and Central Banks use interest
on it to suppress demand and block inflation.
To see the array, click the next "(show)".
div check: sum up row[2] and ensure
dividend shifting from the rich adds to zero:$83 debt row check: 83
The proposal - expand the $2100 Billion holdings of
Canadian Pension Plans
so dividend/interest income will reduce the current
10-to-one income disparity
to
4-to-one.
One of the criticisms of the Laffer Curve above is that
it assumes only one tax rate.
Canadian data shows that the low
50% of taxpayers earn ~30% of GDP, the middle 30% earn ~30%
and the top 20% earn ~40%.
Their Federal + Provincial tax rates
are around 25%, 26% and 28%.
Sliders below add or subtract from ten detailed tax
brackets to show the effects of individual
and corporate tax changes and UBI.
We start from the Canadian 2024 Numbers to get
income tax revenue when you adjust these rates.
Income Disparity, by Decile:
1st 10% earn 2.701%
or $0 dividends:$1904.8 taxes:$4321, debt:$4321k
2nd 10% earn4.901%
or $0 dividends:$1904.8 taxes:$4321debt:$4321k
3rd 10% earn 6.201%
or $0 dividends:$1904.8 taxes:$4321debt:$4321k
4th 10% earn 7.301%
or $0 dividends:$1904.8 taxes:$4321debt:$4321k
5th 10% earn 8.401%
or $0 dividends:$1904.8 taxes:$4321debt:$4321k
6th 10% earn 9.501%
or $0 dividends:$1904.8 taxes:$4321debt:$4321k
7th 10% earn 10.801%
or $0 dividends:$1904.8 taxes: $4321debt:$4321k
8th 10% earn 12.401%
or $0 dividends:$1904.8 taxes:$4321debt:$4321k
9th 10% earn 14.801%
or $0 dividends:$0.119048 taxes:$4321debt:$4321k
top 10% earn 23.0101%
or $0 dividends:$4381.04 taxes:$4321debt:$4321k
% of Capital
0%.
$0
Billion
You may shift capital above, and you may add or reduce
a percentage of the totals to the right:
This should shift capital away from already-wealthy taxpayers,
but still promise them
"
Trickle Up" from increased consumption while CPP bears the tax burden
-
Supply-Side operation instead of "tax and spend".
The CPP fund already pays out disability pensions, and
GST pays low-income households $589 monthly plus $231 per minor.
GST only transfers funds between consumers
(demand-side)
whereas the CPP plan holds capital that works
supply-side
while paying dividends and interest and keeping ahead of inflation.
The holdings of the plan are large and
well-managed
(unlike many others) and could be used to both provide
capital for the overall economy and increase GST payouts
without taxing consumption.
The selling-point is that consumption would be boosted, benefiting
corporate profits - "trickle up" instead of down.
The down-side is that Pension Plans and this boosted CPP
in particular buy up stocks and bonds, reducing the rate
of return by driving up prices relative to dividends.
Two groups will focus on only on their side of this trade-off.
Trickle Up is located on the LHS of the Laffer Curve, and in
Reagan's time the US economy was on the RHS.
Thus Trickle Down worked.
Now, though, labor is being displaced by AI et.al. and
consumption will drop as wages disappear,
shifting everybody toward the LHS.
The major challenge is to persuade Fiscal Conservatives to
believe that times have changed and implementing even more
Reaganomics won't work as in the past.
The above multipliers look like an "elasticity" slider;
they select the percent change to the stimulated
Supply123%
or Demand123% for one percent change in the price.
As you shift Supply and Demand elasticities
(%Q change / %Price change) below, GDP will
respond by123%
(Supply and Demand equalize):
The use of sliders which increase or decrease the
supply and demand is called a
perturbation method. Their starting point is
simplified data from Canada, 2024 as described above.
In an economy, every variable interacts with every
other variable in multiple feedback loops, each of
which generates a near-infinite series solution.
To simplify, this model makes a single pass through a few
variables, approximating what events and governments
can change in a year's time.
The two curves may be linearized with respect to an
origin at p and Q:
Next iteration (1 year), GDP will shift so that
Supply and Demand reach a new equilbrium Price that takes into
account shifts Q in Goods and Services (DmndShift% and SpplyShift%).
This price must also be in equilibrium (equal).
Such shifts will have been specified by the user's sliders
and by the historical 3%/yr growth rate of GDP (supply side).
The left hand sides of the above equations thus become equal, with a
new Q (Supply or Demand) value and a new p (Price) value.
Moving the elasticities, established by the sliders below,
to the LHS makes the RHSides become equal instead:
DmndShift%/DmandElasty = (Price - p)/p and
SpplyShift%/SpplyElasty = (Price-p)/p
The resulting Price on the LHS will be the new GDP:
GDP ≅ p*(1+PriceShift%)
For more accuracy we could have used logarithms above,
giving the curvatures shown in the graph. The result is
GDP[1] = GDP[0]*ePriceShift%,
where PriceShift% is (Price - p)/p from the
various sliders.
Prices are expressed in 2024 "constant dollars" w.r.t.
the CPI, and thus real growth in Q has been ~zero and
can be ignored in the algorithm.
(steep)Supply Elasticity Elasticity is positive because the chart
slopes up.
It is generally less elastic than demand.%/%(flat)
(steep)Demand Elasticity Elasticity is negative - the chart
slopes down.
It is generally more elastic than supply.%/%(flat)
""
Key Interest Rate [3.75%/yr 2024]
Corporate Taxation:
This multiplier selects the percentage drop in Supply
for one percent rise in corporate taxes.
(You set that with the slider above.)
Taxation leads businesses to move capital to other economies,
removing part of what we want to shift to UBI.
In 2024, ~20% of revenue was tax on corporations, which is
competitive.
Tax applies to $1726 Billion in 2024
(the non-government 77% of $2241Bn GDP),
generating $555 Billion in revenue after scaling for deductions.
We will use this for calculating perturbations.
Taxation has a strong impact and thus the
multiplier below
(%decrease in taxes to %increase in investment)
can be as high as double.
The slider above "perturbs" the corporate tax rate,
increasing or decreasing it 4321%
relative to 2024.
The slider below lets you specify the impact4321% on
the capital supporting production.
For 2024 (called iteration zero), corporate tax is simply 21% of total
revenue, which we will assume equals government spending;
23% of GDP or $515.4Bn.
For 2025 (iteration 1), the tendency of capital to flee
elsewhere is the % shift in Corporate Tax above
times the mulitplier selected below.
After all the sliders have shifted ("perturbed") supply and demand,
the overall percentage shift will be applied to the equilibrium
between Supply and Demand.
The percentages of GDP for Consumer Spending, Investments
and Government Spending will not likely add up to 100%,
so the final step will be to normalize it to 100%.
%/% multiplier
Corporate Tax Companies show moderate %/% ratio. They
do business elsewhere when taxes are high.Rate 25% [~25%/yr 2024] Tax to ProductionWarning: elasticities are normally
X (supply) to Y (price). This is reversed.??
The Big Three: Land & Resources
(>$19Tn)
Conventional Econ 101 courses would say there
are three inputs to the production/Supply side
of the equilibrium between Supply and demand.
Land is the first one, and it includes
resources such as oil/gas or metallic ores.
Some people would include buildings on land.
This model examines only:
shift of capital to UBI,
taxation and
the Key Interest Rate.
Thus we will not include a
slider for Land.
The other two inputs are Labor and Capital.
Recently, part of labor is split out
as Entrepreneurship.
Below is a separate slider for you to adjust.
The Big Three: Labor & Skillsets
Economics is all about incentives, and UBI gives
low-income people the potential to stay out of the
work force. The slider below lets you guess what
percentage reduction in Supply will result from
one percent of UBI being paid to supplement wages
for jobs that "nobody wants". N.B.: think of the
potential impact of innovation; which will be
handled by Entrepreneurship below.
In general, labor refers to activities performed by
people who do not focus on developing/acquiring
capital. This would include operating capital equipment,
providing services like retail and education and
tracking resources etc.
Thus income to this group of people is allocated to
consumption rather than production. We will assume
all income to the lowest two income groups go to
the demand side above.
To compensate for over-emphasizing consumption by
the middle group we allocate all spending by the
top group to supply, using the "Entrepreneurship"
category below. See groupGross = [ 0, 0, 0 ]; $123%
%/% multiplier
The Big Three: Capital & Machinery
Capital means goods and services which are producced
for making the things consumers eventually buy.
Included would be machinery/buildings, intellectual
property and inventory.
We focus on UBI, Taxation and Key Rates but in
addition the slider below lets you look at the
impact of governments making direct investments
voters want but private investors do not deem
profitable.
Select the percentage of Government spending that
you will allocate to investment/Supply side.
Govt Capital:
[5% 2024]
""
Make It Four: Entrepreneurship
Labor includes services like retail and education and
accounting etc. However, these activities may result
in "bright ideas" that boost the effect of capital
and labor.
We make the assumption that the top two deciles have
the majority of these ideas, and with the slider below
you may specify a %/% Multiple of wages paid to them
that accrues to the Supply side of GPI.
%/% multiplier
Inflation: Central Banks adjust the cost of borrowing to
shrink/expand the Money Supply to keep the montetary value of a
"basket of goods and services" ~2% above last year.
Note that the ratio of Capital to Consumer expenses is
21 to 55 above, and 2/3 of working capital is debt.
Thus increasing the cost of debt increases
public companies' cost of production by 55%/21%*2/3.
However, private corporations have lower debt ratios and
generate more of the GDP.
Thus cost of borrowing has more impact on demand than on
production.
Also, yield for corporate bonds has been the same 8.54% as profit margin
but with no growth.
Yield is much slower to respond to key interest rate changes
than consumer debt is; thus interest rates suppress
demand rather than supply.
Rough Notes
GDP equals spending;
23% spending by Governments, the revenue for which was
Personal Income Tax 46.4%,
Non-Resident Income Tax: 2.9%
($254.1Bn total)
Corporate Income Tax: 21.0%,
($108.24Bn)
Other: (GST, energy taxes, etc.) 29.5%.
($146.9Bn)
77% requiring capital:
Average net profit margin was 8.54%. (Gross across all industries 36.56%)
Thus total capital is about 0.77*2.241/0.0854, which equals $20.2 $Trillion.
Total asset value of Canadian businesses was $17 trillion as of 2022. ($2.5 trillion foreign-controlled.)
We will use $20 trillion working capital.
($20,200Bn)
55% on consumption,
=>Shelter accounted for 32.1% ($396Bn) and food 15.7% ($192Bn)
of consumption. =>
Household mortgages are a large portion of debt.
The total value of Canada's housing assets was
$4200 Bn in 2024, so the equivalent of rent would be .396/4.2 or 9.4%/yr.
=>~1/3 of households (~5 million) rent their homes.
=>
Household debt was 176.4% of disposable (gross-tax) income.
This ratio is similar over income levels.
21% on investment
=>
Households saved approximately $3785 each: 3.8% of GDP,
totaling $85.2 billion.
Savings are what is left over after Consumption, Interest and Taxes;
and by the Savings Identity,
it is part of overall Investment of 21% of GDP.
and 1% net exports.
The need for investment/savings drives the "tax and spend"
objection of the political right.
However, lower labor cost gives corporate savings
to invest when wages do not have to cover services
and infrastructure that are public.
GDP also equals income:
distributed over 31.814 million tax returns
(22.5 million households).
Consumer spending gives Corporate Income,
part of which is diverted into Savings/Investment.
However, much of investment comes from debt.
Button (more)
hidden>
Debt-to-assets ratio for Canadian private non-financial
corporations was 44.20% in Q2 2024.
Small/Medium businesses employed 64% of private sector labor force.
We will assume they were all private.
Thus their debt is ~44.2% of 64% of $20Trillion or 5.7 Trillion.
For a public company Debt-to-assets ratio is around 67%.
By the above assumptions and reasoning, their debt is ~67% of 36% of 2)
or $2.8 Trillion.
Note that these are rough approximations that hopefully
show the effects of Central Bank policy changes below.
Aside: The price-to-book (P/B) ratio for the TSX was approximately 2.40. Total market cap for the TSE is about $4905 Billion.
Debt-to-assets ratio for Canadian private non-financial
corporations was 44.20% in Q2 2024.
Small/Medium businesses employed 64% of private sector
labor force. We will assume they were all private.
Thus their debt is ~44.2% of 64% of $20Trillion
or 5.7 Trillion.
For a public company Debt-to-assets ratio is around 67%.
By the above assumptions and reasoning, their debt is
~67% of 36% of 2) or $2.8 Trillion. Note that these are
rough approximations that hopefully show the effects of
Central Bank policy changes below.
Aside: The price-to-book (P/B) ratio for the TSX
was approximately 2.40.
Total market cap for the TSE is about $4905 Billion.